Market Trends Types of Trends and How to Identify Them
Market Trends: Types of Trends and How to Identify Them
What Is a Market Trend?
“Market trend” refers to the movement of a particular financial market over a certain period of time. The movement may be described as “upward”, “downward” or “sideways”, and market trends themselves may be classified as secular, primary, or secondary depending on their duration.
Traders, investors, and speculators typically turn to news sources that they trust or are familiar with for information on market trends. Using trading platforms that focus on charting and technical analysis may also help in the identification or prediction of upcoming market trends.
Secular Market Trends
Secular trends are essentially sequential primary trends that move in the same general direction. Any corrections that occur will take place within a relatively short span of time. Secular trends last anywhere from five to 25 years.
In a secular bull market, a prolonged series of bull markets may be interspersed with occasional periods of bear markets.
Primary Market Trends
Primary trends are among the most frequently observed market trends. They generally last for a year or longer. Taken altogether, a string of primary trends may comprise a secular market trend.
Bull Market
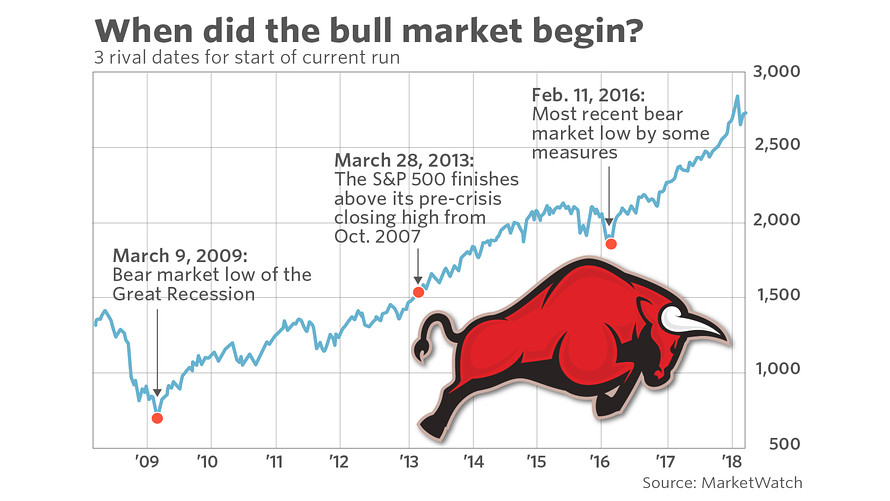
Image source Market Watch
The term “bull market” refers to a period wherein the prices of assets exhibit a consistent upward trend. This may last from several months to several years. Although the term is commonly used in reference to stock market trends, it may also be used in reference to real estate, bonds, or foreign exchange markets.
A clear indicator of a bull market is an extended upward trend in 80% or more of stock prices. An increase in market indices of +15% or more may also indicate the presence of a bull market.
Not all market sectors will experience a bull market at the same time. More often than not, some sectors may experience bull markets while others remain unchanged, or even move in the opposite direction.
There are many reasons why bull markets occur, and they may be manifested in different ways. In general, however, most financial analysts agree that bull markets are influenced by economic cycles and investor sentiment to a significant degree. It is also believed that high employment rates, abundant disposable income, and healthy business profits – all signs of a strong economy – point toward a bull market.
Bull markets are usually looked upon with favor by investors due to the increase in prices across the board. However, it isn’t always easy to predict an impending bull market. Therefore, investors will have to develop the ability to know when to buy or sell with the goal of maximizing profit. It would also may benefit investors to time their actions appropriately depending on whether the bull market is beginning or ending.
Bear Market
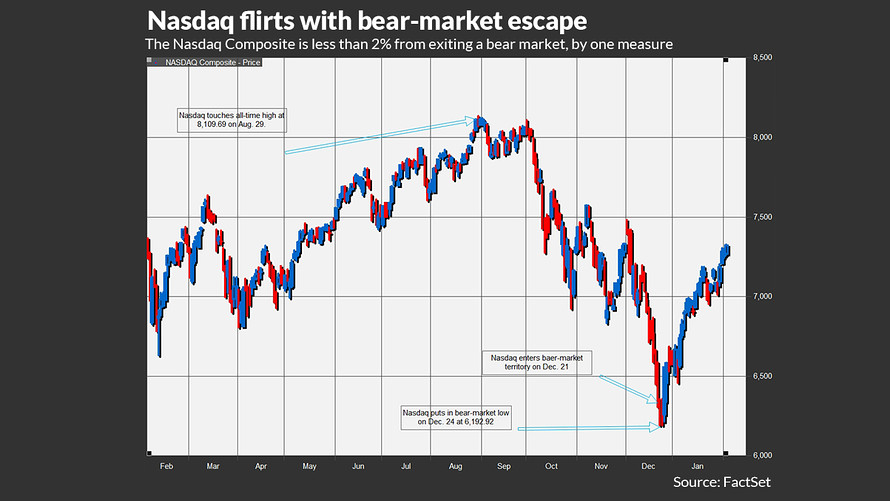
Image source Market Watch
A bear market is the opposite of a bull market. This is characterized by a consistent downward trend in the prices of securities, which may take place over several months or years. As with a bull market, the term generally refers to the state of the stock market, although it may also apply to the real estate, bonds, or foreign exchange markets.
Many of the same indicators used to identify and predict a bull market apply to bear markets, as well, except that the trend is downward. A consistent drop in the prices of 80% or more of all stocks is a clear indicator of a bear market. This may also be indicated by a -15% fall in market indices such as the Dow Jones Industrial Average.
As with bull markets, bear markets may occur at different times across different sectors. Their causes and characteristics vary, too. However, economic cycles and investor sentiment are both attributed to the occurrence of bear markets.
Among the factors that may bring about a bear market are low employment rates, low disposable income levels, and reduced business profits, all of which are signs of a weak or faltering economy.
The terms “bear market” and “bull market” are often used to describe the financial market in its entirety. However, both terms may also be used in reference to specific sub-markets.
Market Top
Market top is when the prices of securities begin to exhibit a downward trend after a prolonged upward trend. At this point, the prices of securities or indices are at the highest they have been over a specific period. If a particular stock has been bullish for several months, its price at the time when it begins to decline is referred to as the market top.
Market Bottom
Market bottom is the opposite. This is the lowest price of a particular stock at the precise point when it begins its upward trend. If a particular stock has been in a bear market for several months for example, its price just before it begins to increase is the market bottom.
Once a market bottom has been identified, prices are unlikely to go down further. In the event that this does happen, the market may experience a frenzied period wherein stockholders attempt to cut their losses by selling off their stocks.
Secondary Market Trends
Secondary market trends take place over a relatively short period. In most cases, these are simply reversals of primary trends taking place over a period of a few weeks to a few months. A bullish primary trend would typically be followed by a bearish secondary trend. This is often described as market “correction.” The bull market that follows a bearish primary trend is generally described by a less flattering term: “suckers” rally.
Markets of all types have their own trends. By getting familiar with these trends and pinpointing patterns, you can increase the success of your short- and long-term investing. Want to learn more about market trends. Contact Forest Park FX today.


